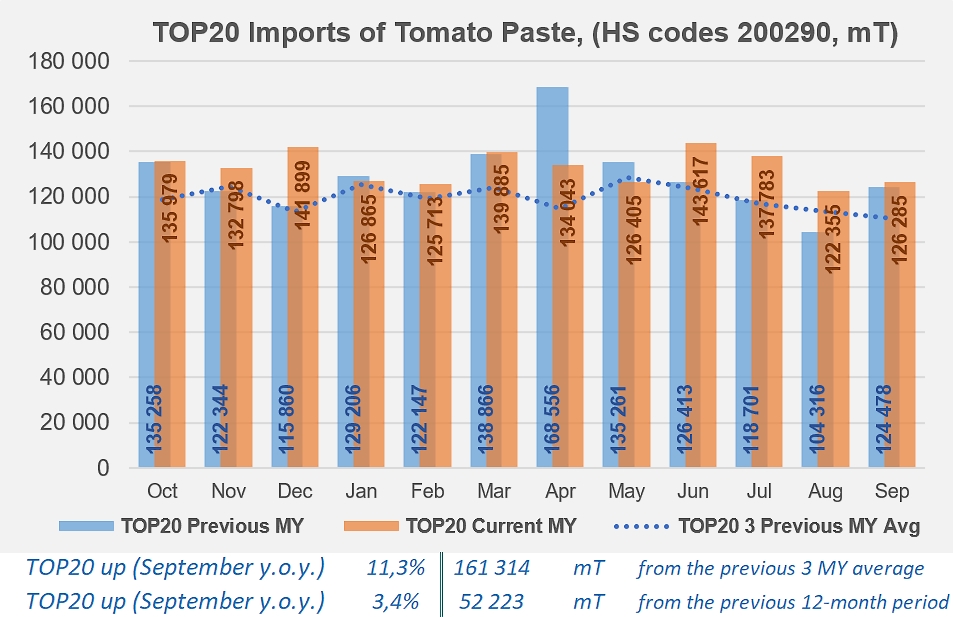
The total quantities of tomato paste imported worldwide over the past twelve months (October 2020 - September 2021) were approximately 52,000 mT (3%) higher than in the previous corresponding period, and 161,000 mT (11%) higher than the average of the same period of the three previous marketing years.
Comparison of monthly imports over past two years
Along with its monthly summaries of the prices for pastes and canned tomatoes and of the performances of the world’s main tomato paste exporting countries (see linked articles below), Tomato News is presenting updated figures of the supply volumes shipped each month by the main consumer markets for tomato products.
For tomato paste, alongside the combined figures for the Top20 importing countries, this article presents data for France, Germany, Japan, the Netherlands, Poland, Russia and the United Kingdom; canned tomato imports for Belgium, Canada, France, Germany, Japan, the Netherlands and the UK; and finally sauces & ketchup imports for Canada, France, Germany and the United Kingdom. This provides a regular and representative overview of the situation and trends of global demand.
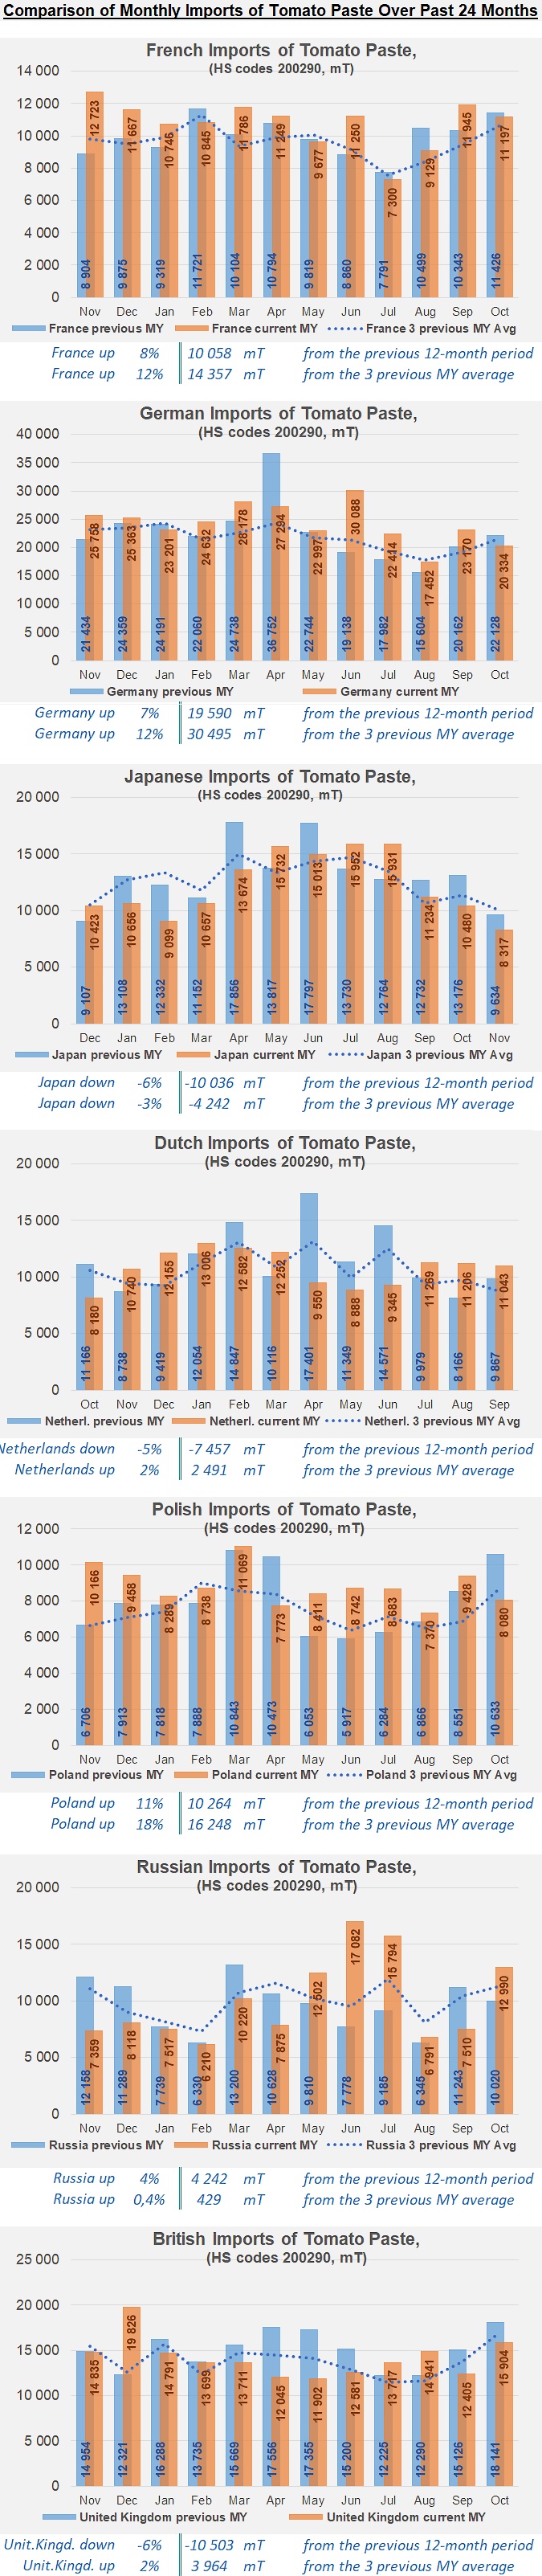
Tomato Paste (HS codes 200290)
Imports of pastes to the twenty most dependent countries (whose domestic consumption depends solely on external supplies): for greater clarity, the histograms now present as an additional reference the curve (blue dotted lines) of the average activity of the same months of the three previous marketing years.
Germany, United Kingdom, Japan, Netherlands, Russia, France, Poland, Mexico, Belgium, Canada, Sweden, South Korea, Austria, Philippines, Switzerland, Romania, Kazakhstan, Thailand, Norway and Costa Rica
The following seven selected countries accounted for 43% of the sector’s total imports on average over the last five years, with the remaining 57% distributed over approximately 90 countries.
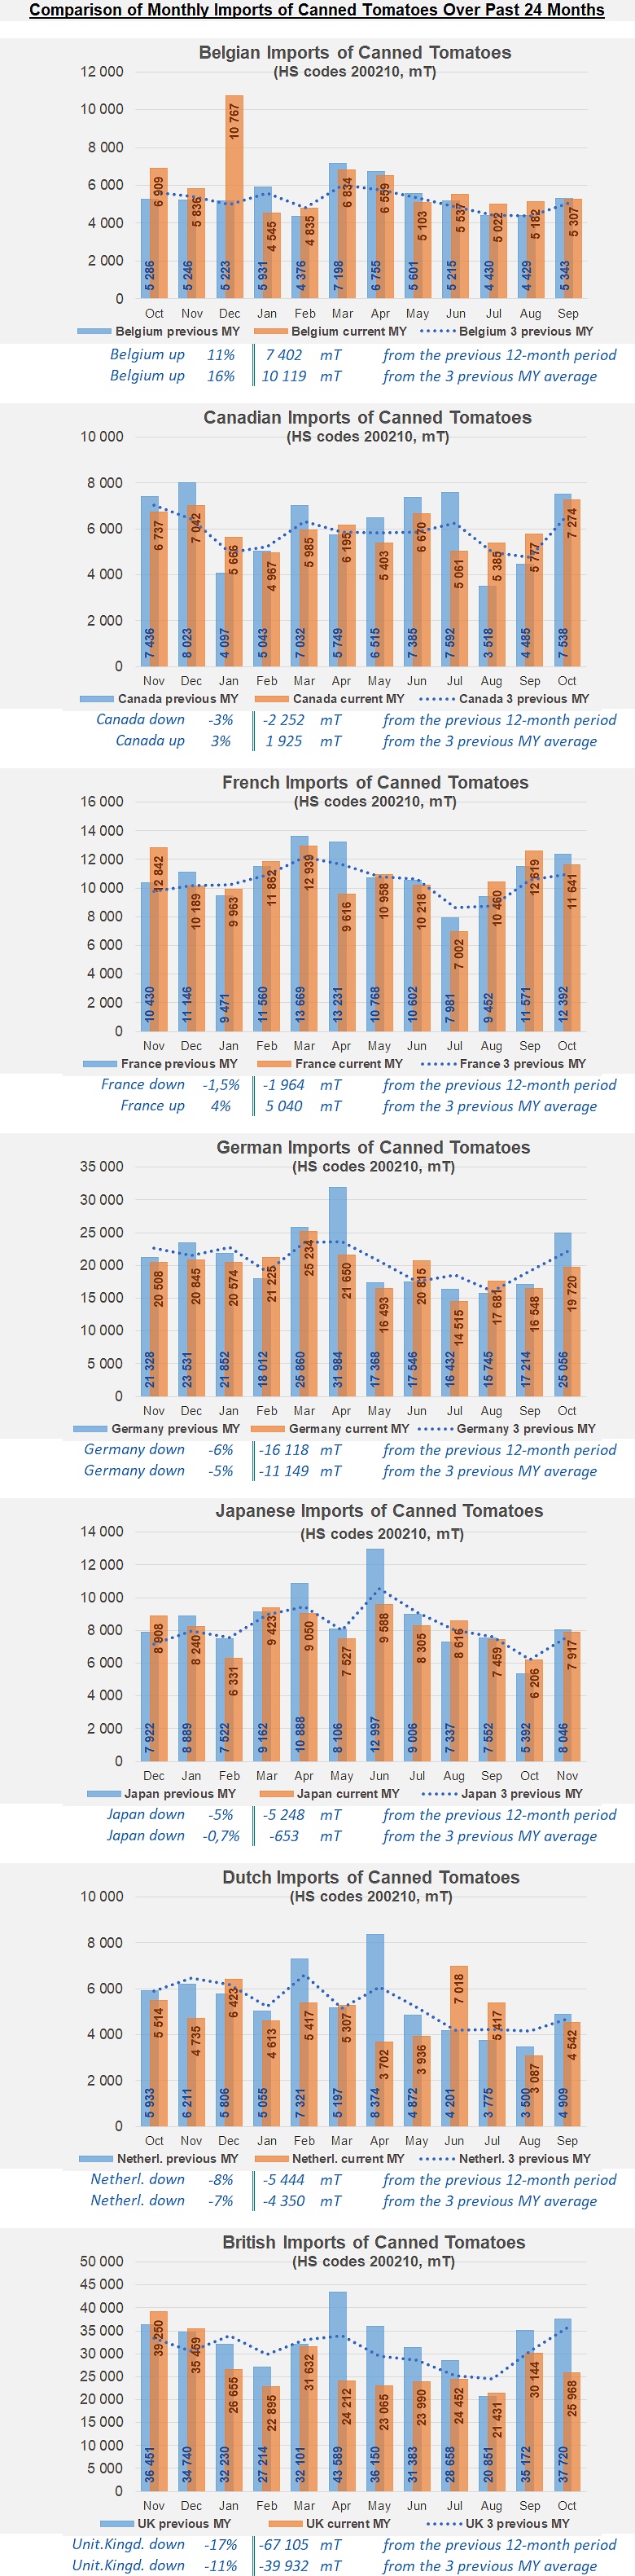
Canned Tomatoes (HS codes 200210)
The seven countries presented accounted for 66% of the sector’s total imports on average over the last five years, with the remaining 34% distributed over approximately 90 countries.
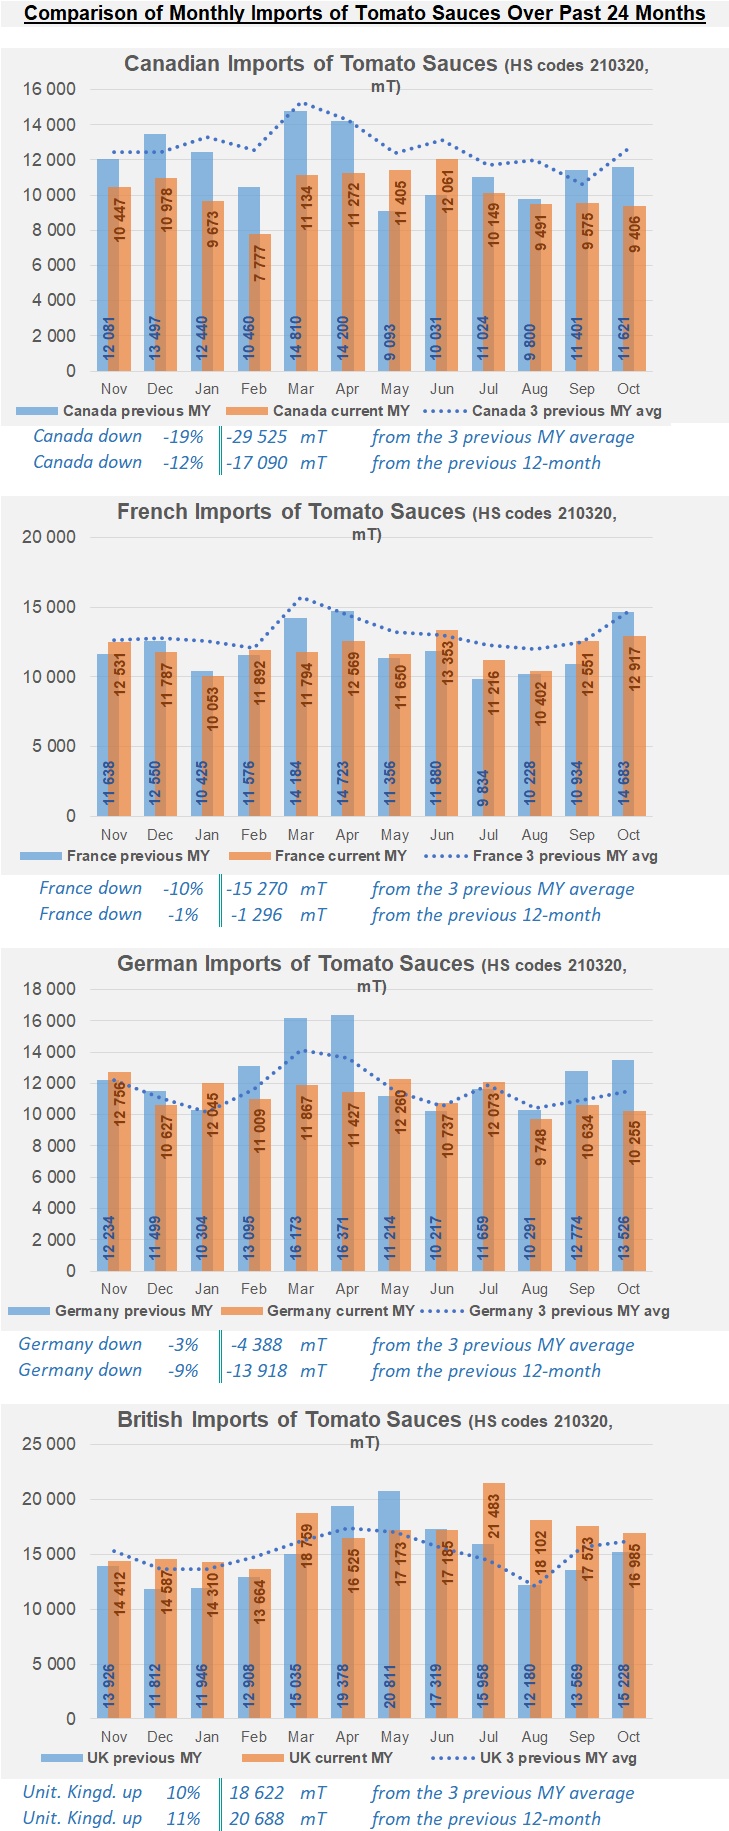
Tomato Sauces (HS codes 210320)
The four countries presented accounted for 47% of the sector’s total imports on average over the last five years, with the remaining 53% distributed over approximately 92 countries.
A comparative analysis of the detailed performance of the main exporting countries and the demand of the major importing regions for the full marketing year 2020/2021 was published in our Yearbook, available from November 2021. The dossier is available also by clicking here.
To book your copy of the Yearbook 2021, click here
This information is sourced from trade statistics provided by the various national customs services of the countries concerned (all of which are regularly audited for reliability by information-collecting services at a worldwide level), as well as from other official or professional sources. Countries are listed in alphabetical order.
This monthly summary can evolve, and should evolve. So do not hesitate to contact the Tomato News team in order to obtain specific results or suggest extending the list to other countries where markets are significant.
Source: Trade Data Monitor LLC, professional sources